Research what actually works
120+ financial metrics computed across 5,000+ US stocks, with factor rankings, quintile analysis, and threshold scanning. See which metrics have historically lined up with returns instead of guessing.
Research what actually works, build multi-factor strategies as visual rules, backtest against 20 years of real history, and — when you're ready — execute through your own Interactive Brokers account, reviewing every order before it goes out. One desktop app, no code.
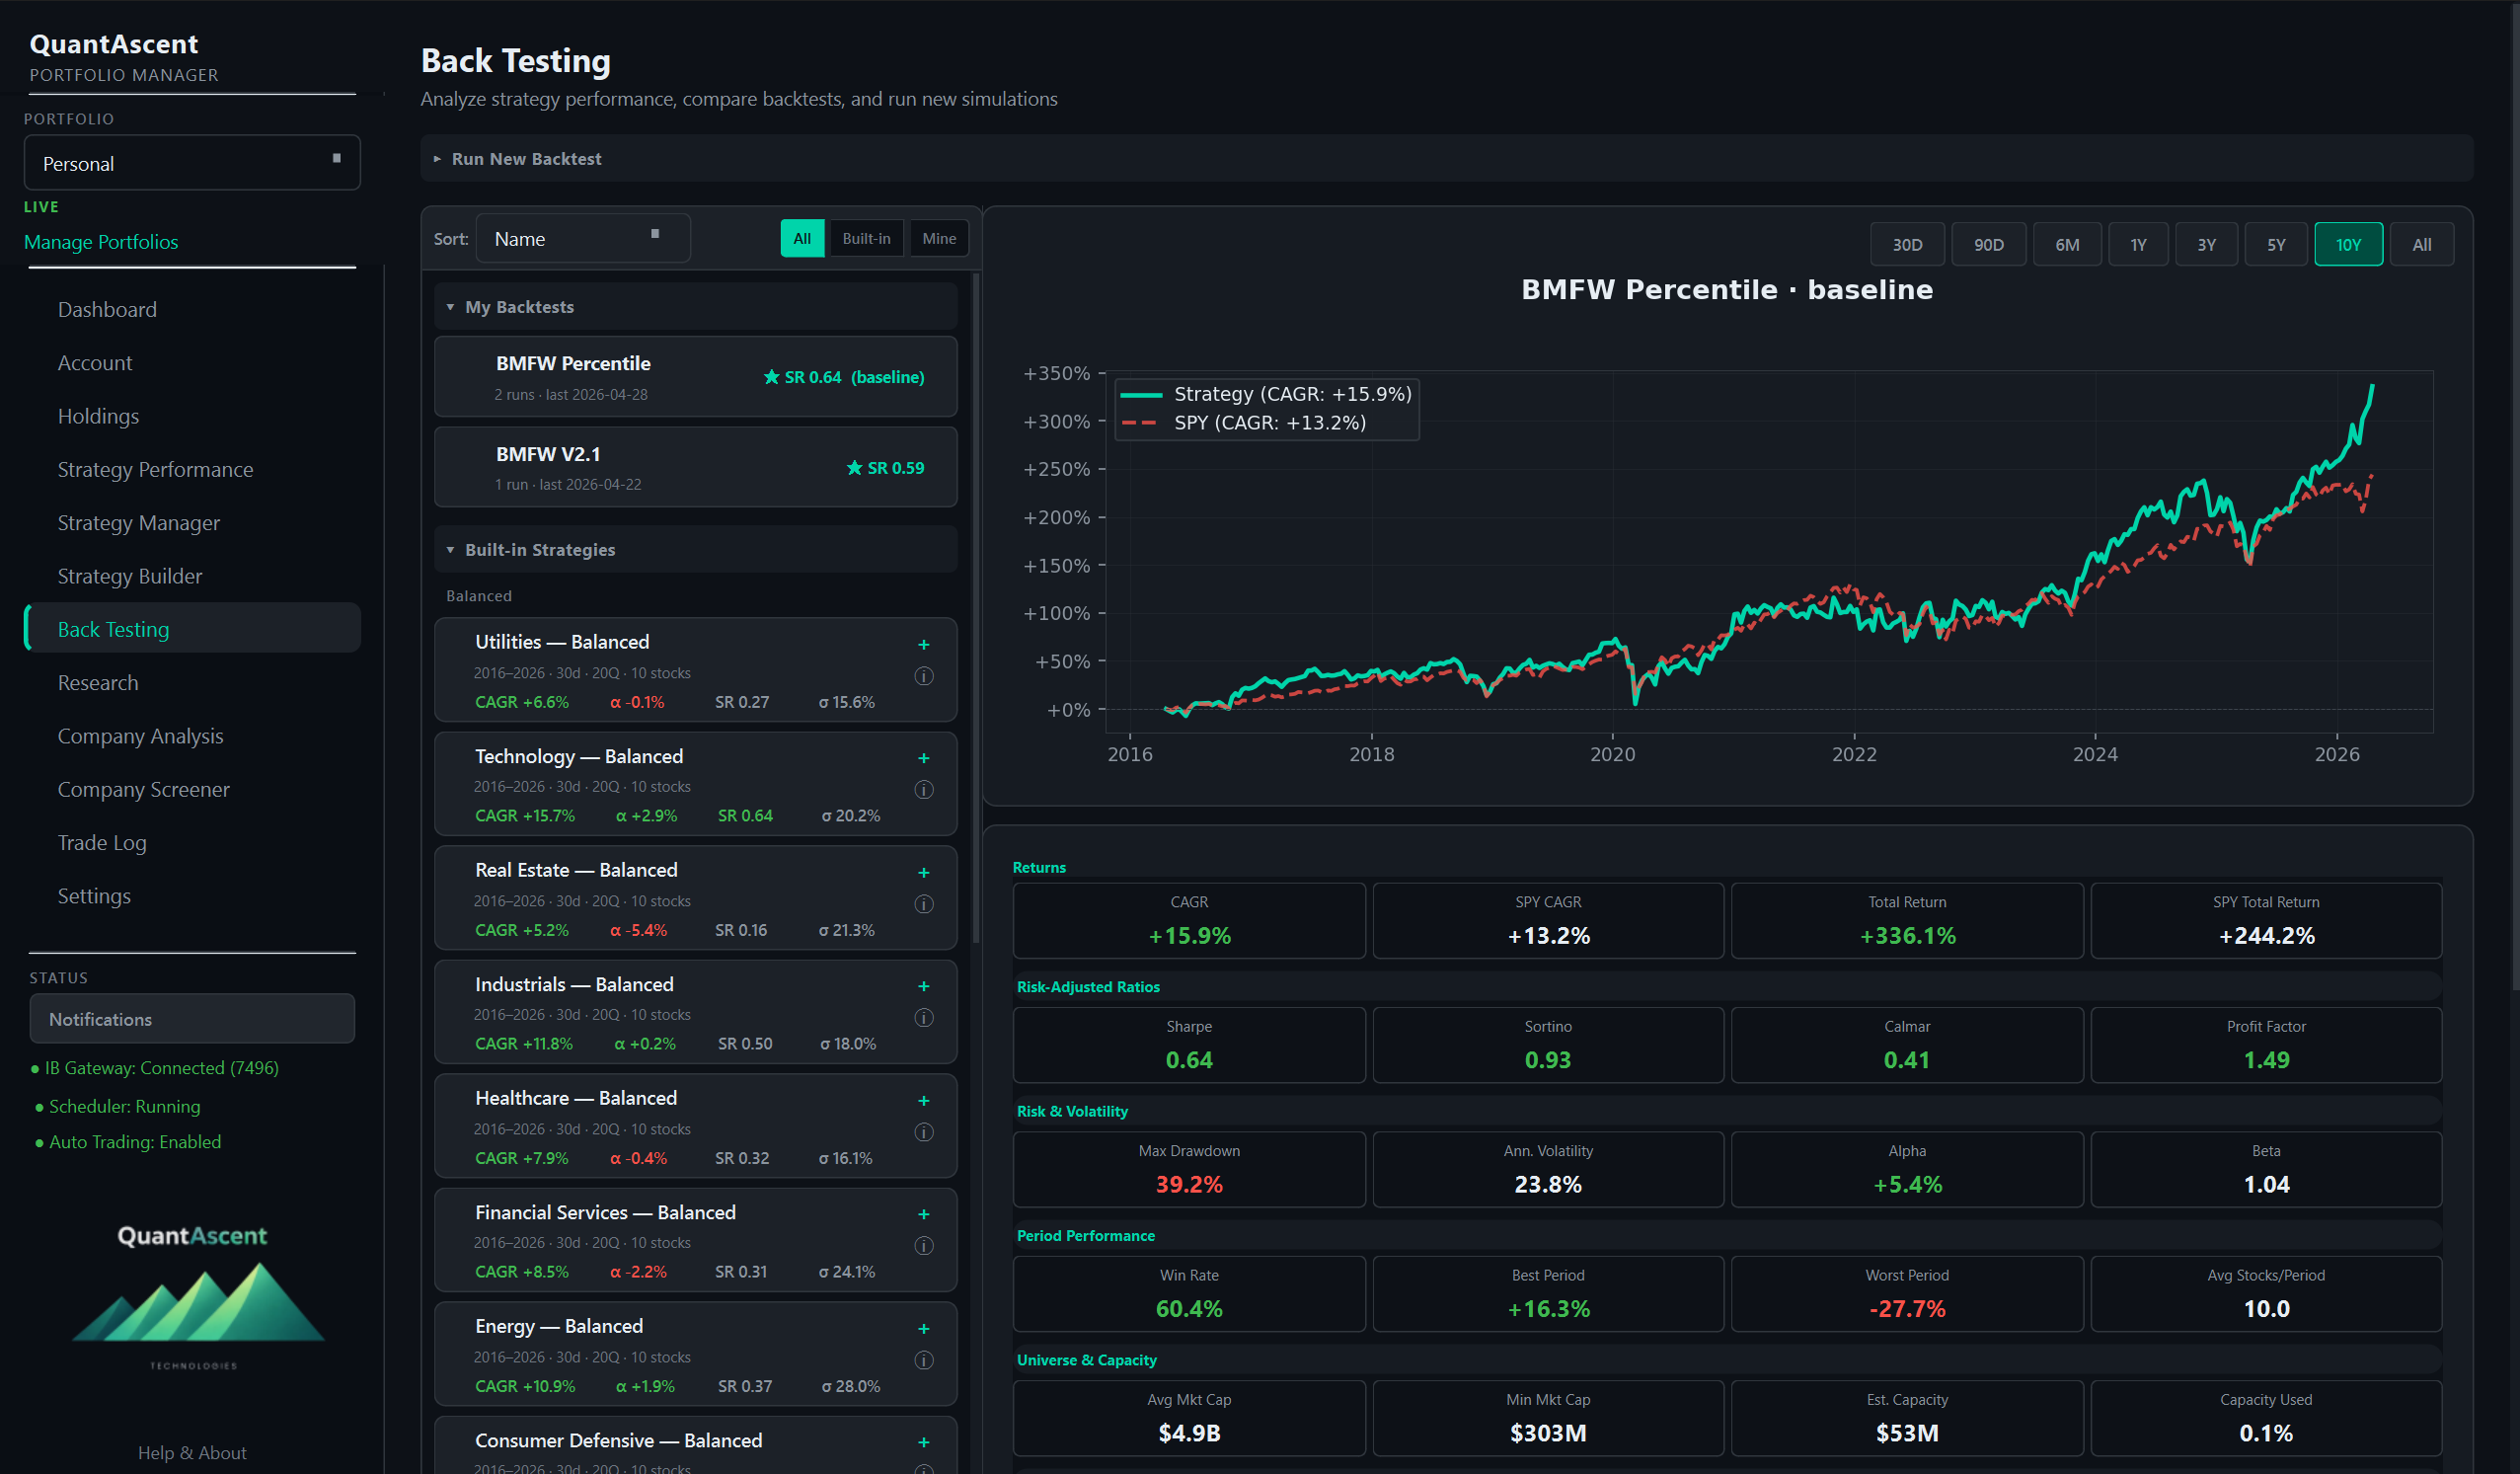
Sample data shown for illustration — not a performance claim or projection.
A complete workflow for systematic equity investing — each step grounded in real data, and each step transparent enough that you can defend its assumptions.
120+ financial metrics computed across 5,000+ US stocks, with factor rankings, quintile analysis, and threshold scanning. See which metrics have historically lined up with returns instead of guessing.
Compose multi-factor scoring strategies as cards. No code, just rules: free cash flow yield, return on capital, momentum, debt levels. Add filters for sector, market cap, country.
Run your strategy against real historical data. Get 16 performance metrics — Sharpe, Sortino, Calmar, alpha/beta, max drawdown, win rate — all benchmarked against the S&P 500.
Connect Interactive Brokers and rebalance in one step — you review and approve every order before it's placed. Every trade, lot, dividend, and tax event tracked automatically. See your real performance against the benchmark.
Four places you'll spend most of your time: the metric explorer, the strategy builder, the backtest report, and the rebalance preview.
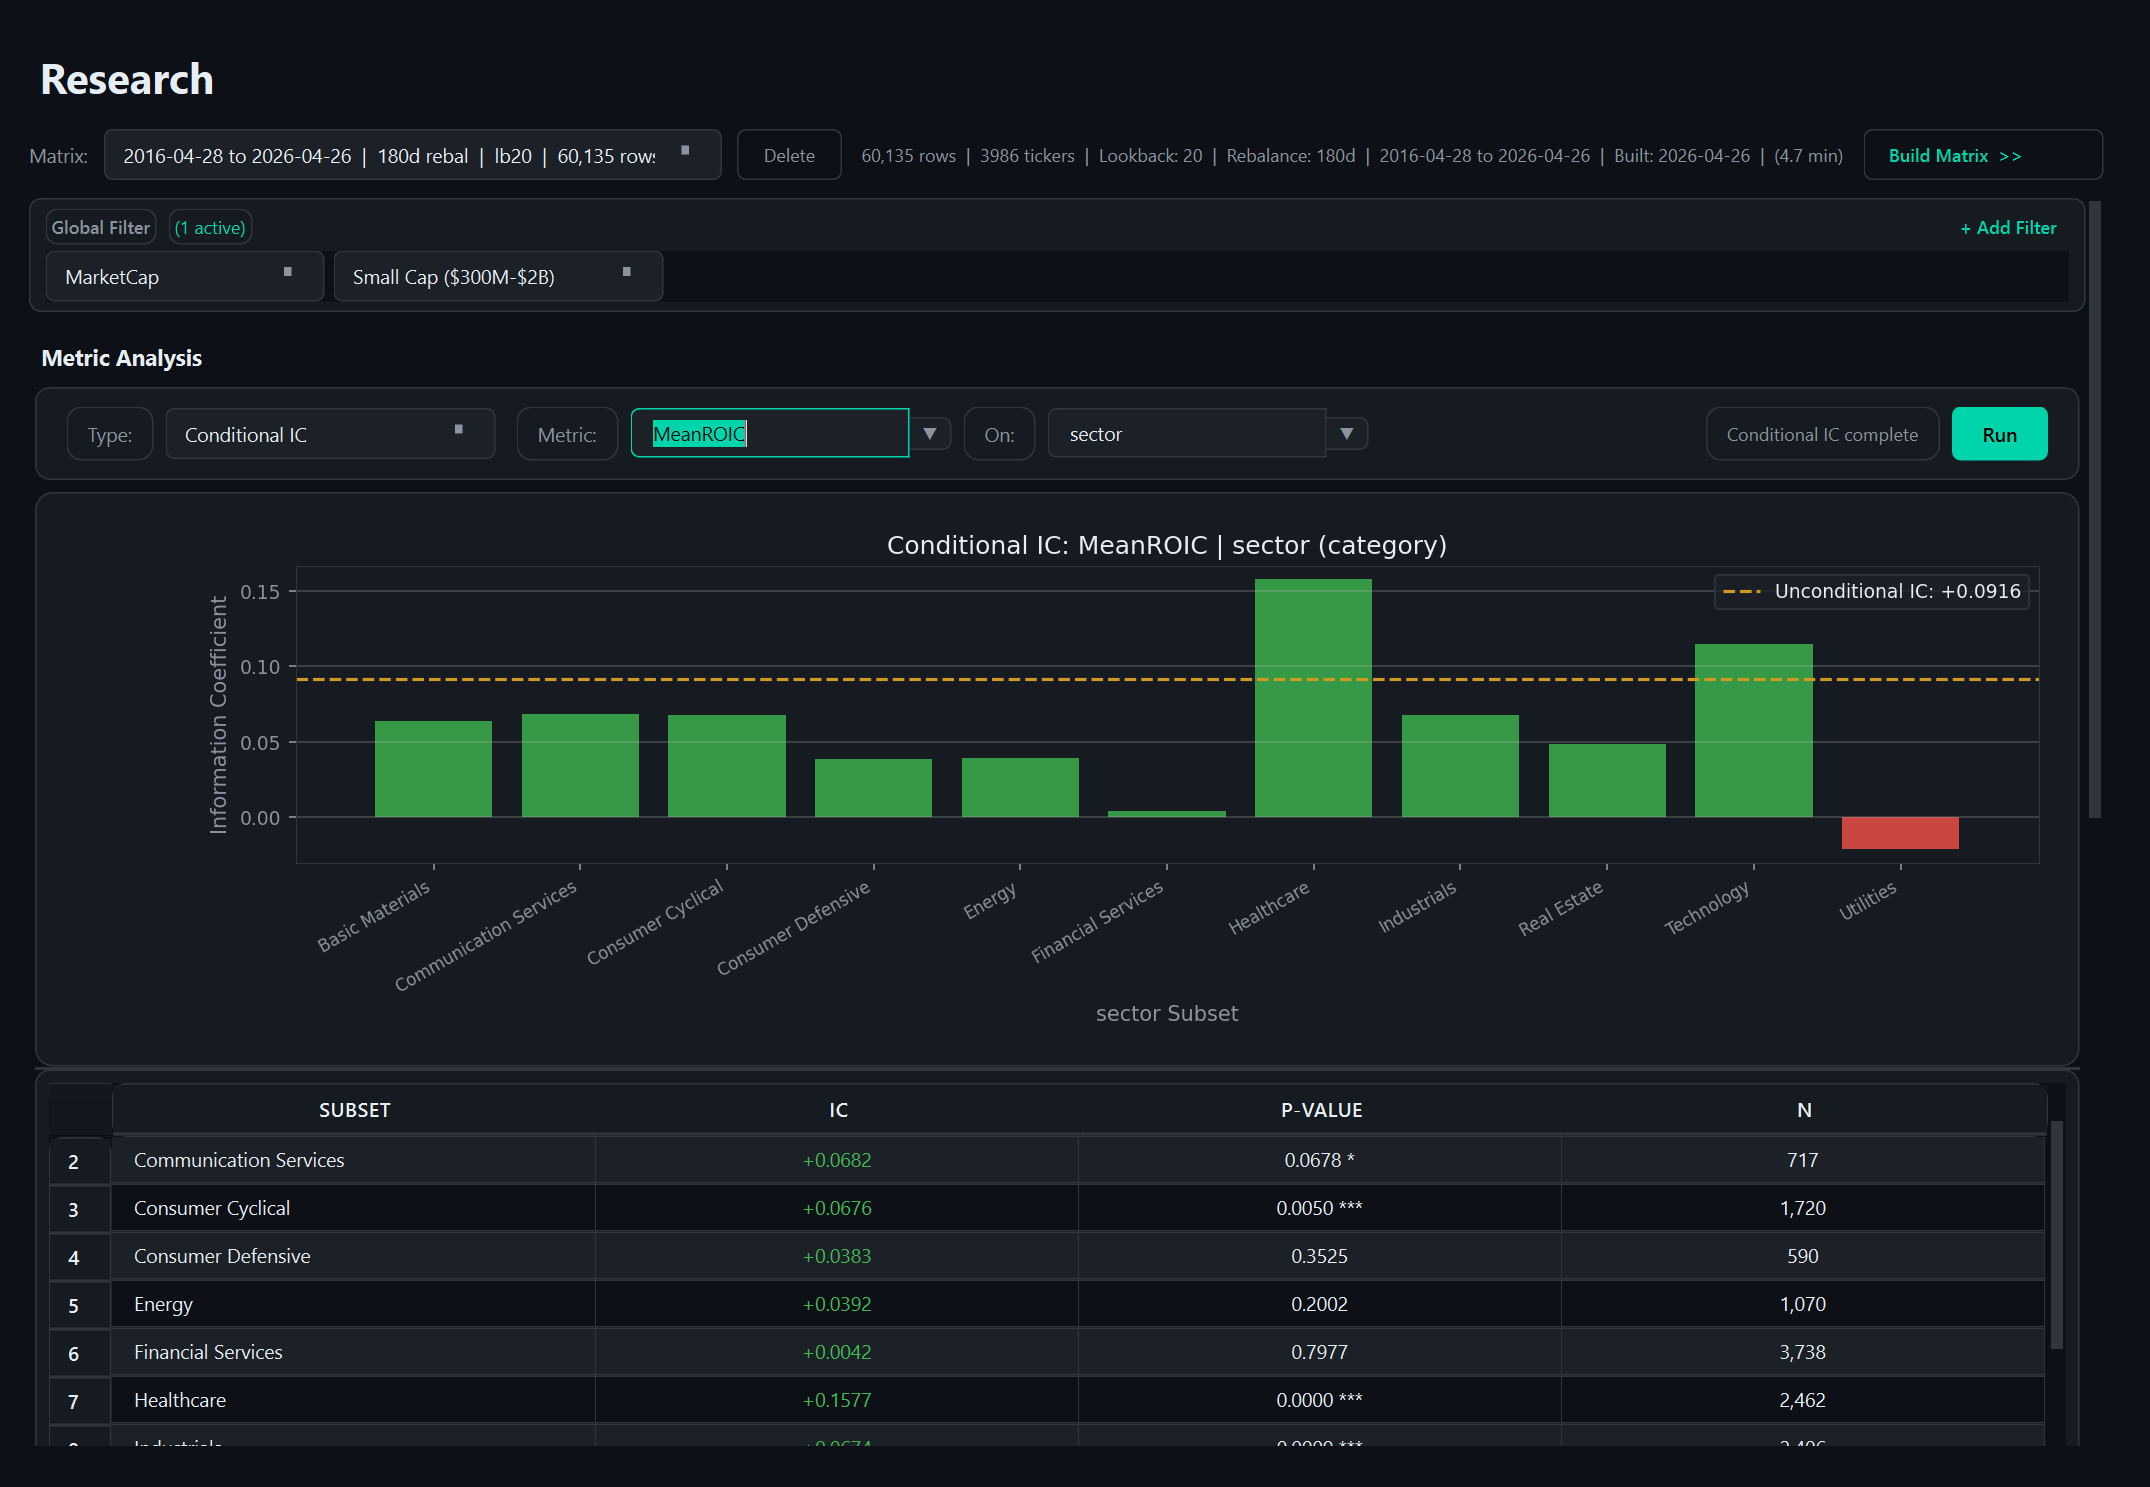
Pick any of 120+ metrics, see how it has separated winners from losers across two decades, and decide whether it earns a place in your strategy. Quintile breakdowns, threshold scans, and factor rankings — all from real fundamental data.
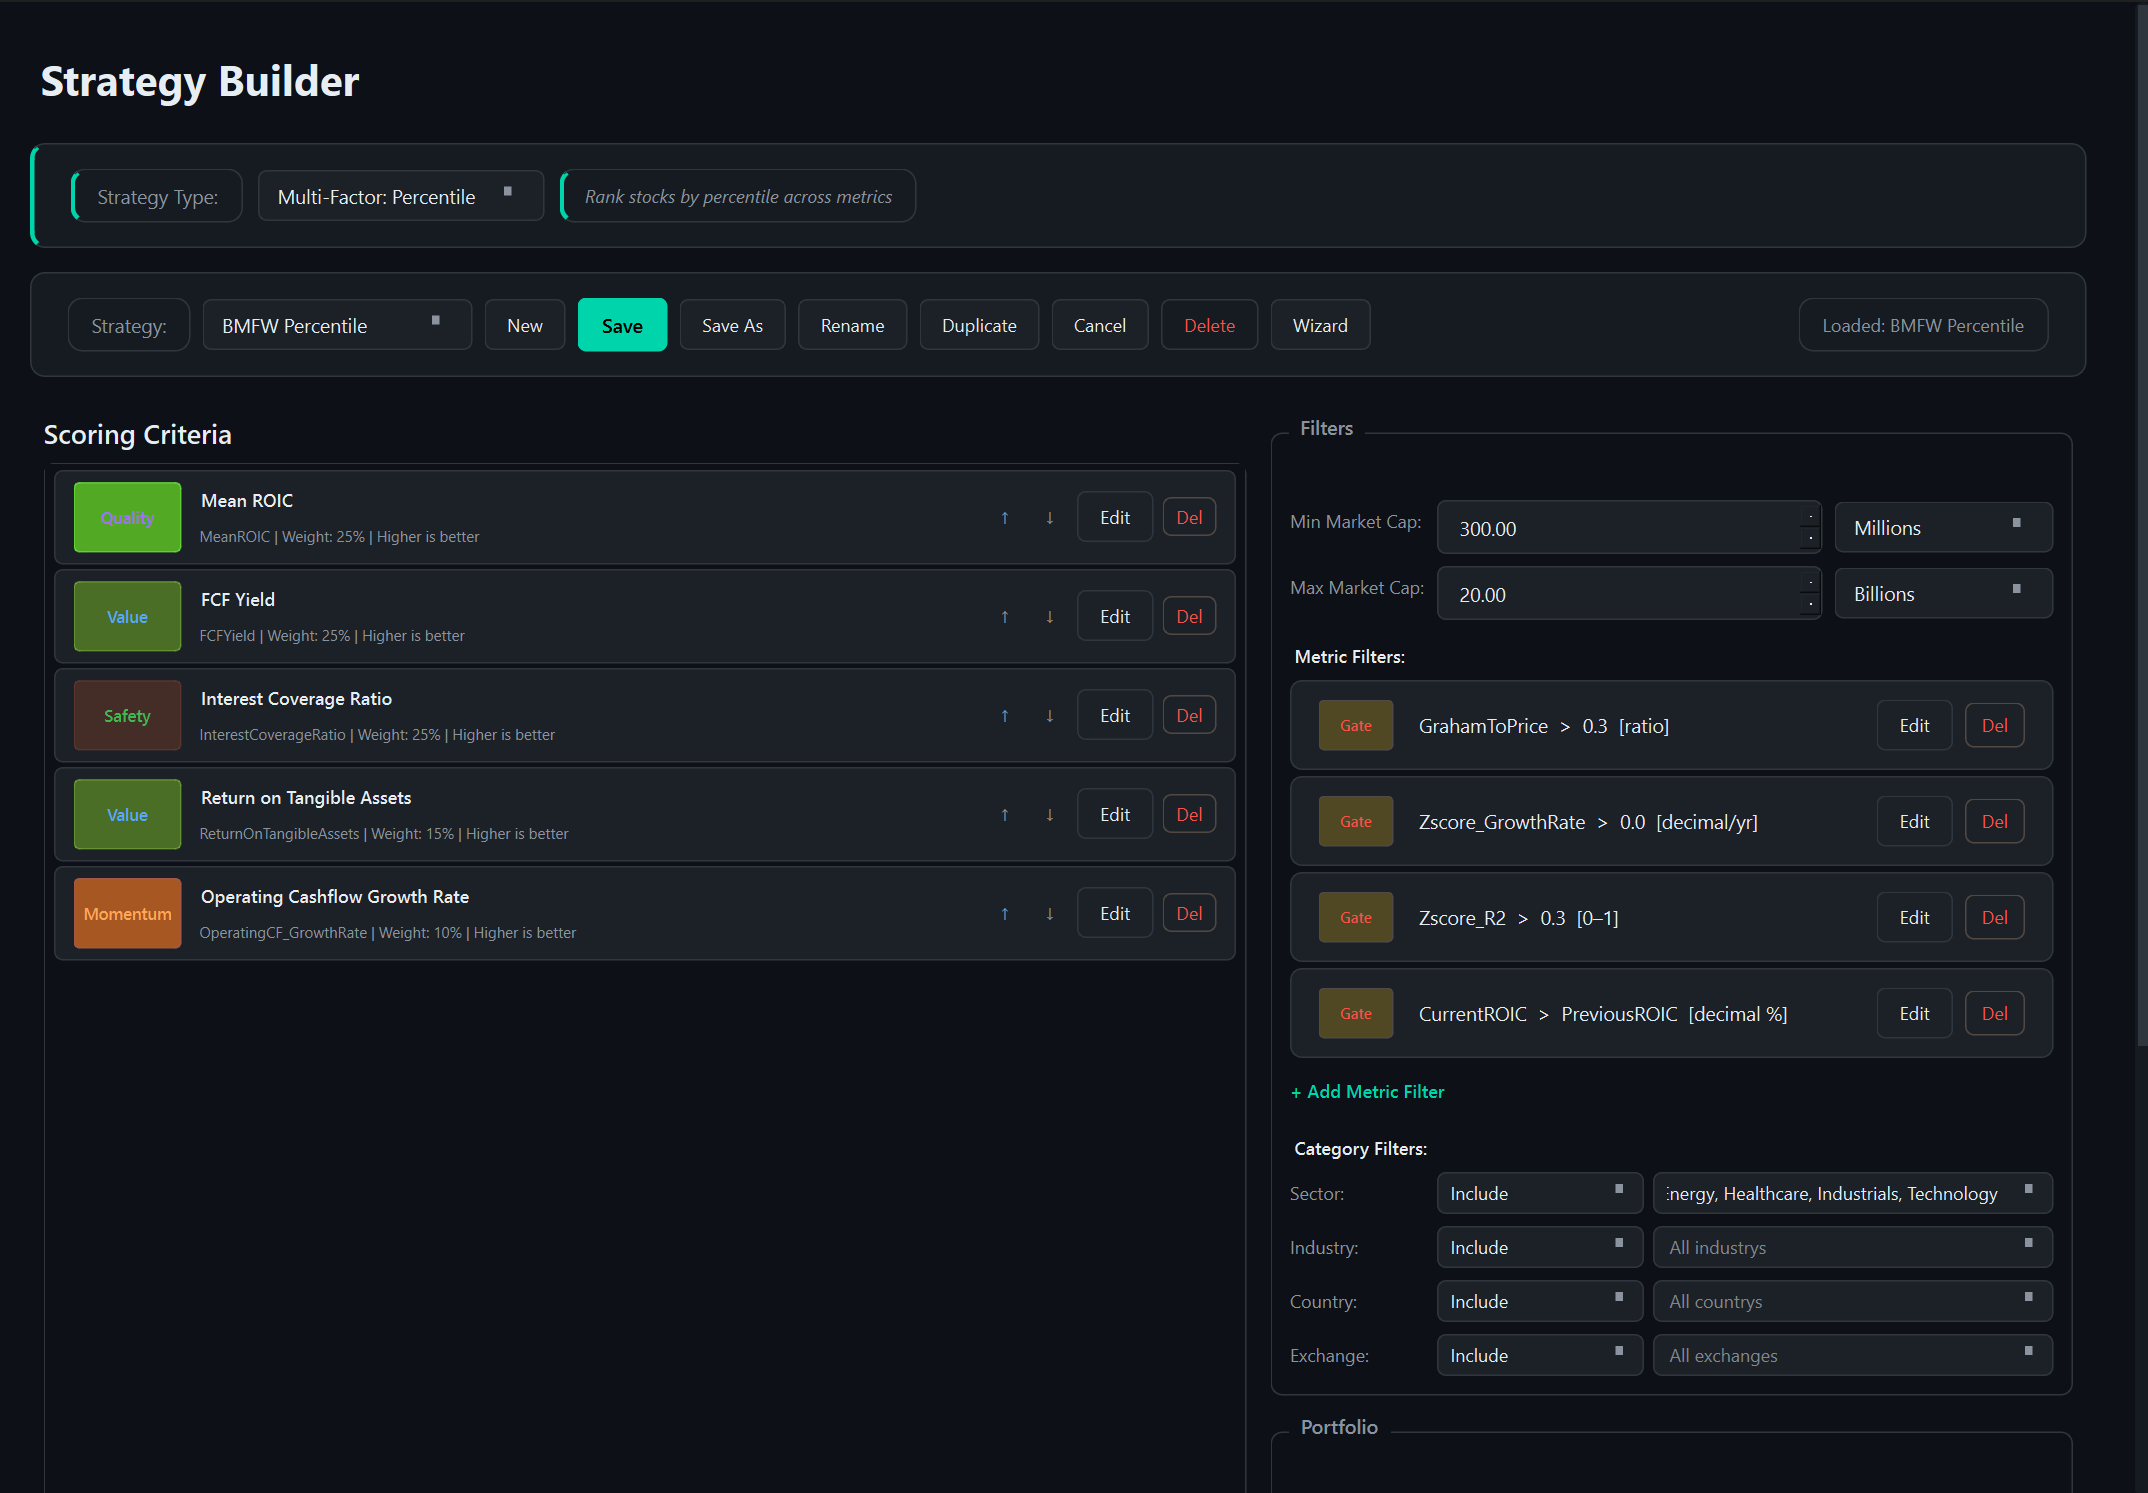
Stack factor cards, weight them, layer filters. No code, just rules. Save versions as you iterate, branch when you want to test variants, and pick which one to backtest next.

Hypothetical backtest of an example strategy — not a projection or a performance claim.
16 metrics — Sharpe, Sortino, Calmar, alpha, beta, max drawdown, win rate, and more. Every backtest benchmarked against the S&P 500 and your filtered universe, and saved automatically so you can compare runs side-by-side.
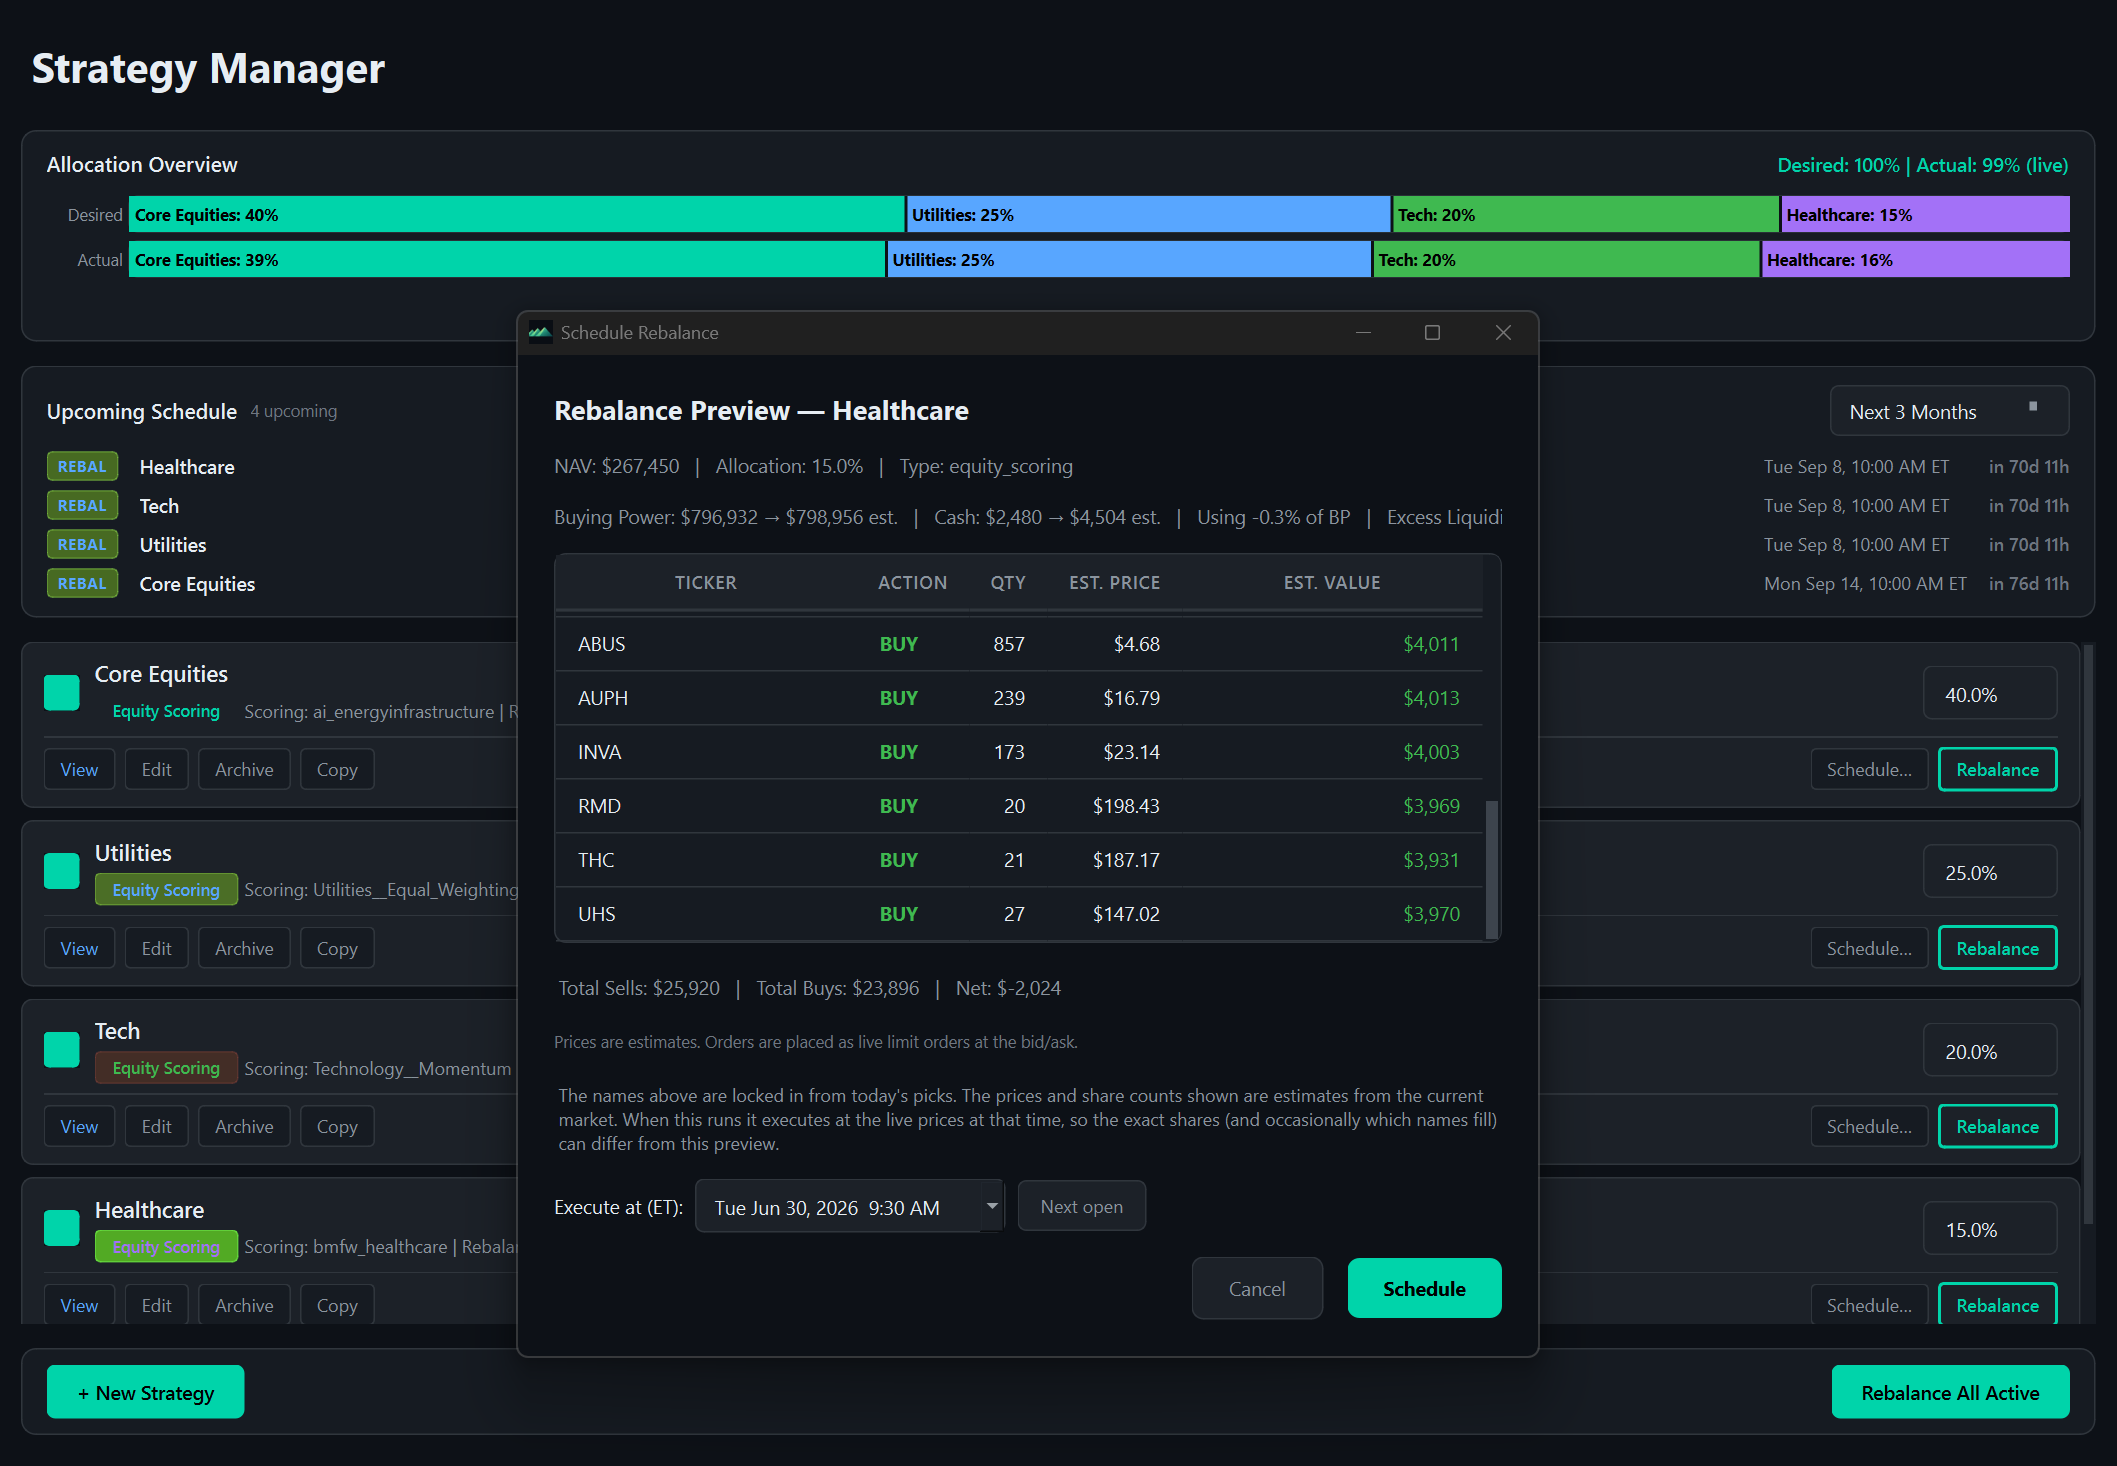
Sample data shown for illustration.
When you rebalance, QuantAscent computes the trade list from your strategy's rules and shows you every order — ticker, quantity, estimated price — before anything is placed. You review, you approve, and it executes in your own Interactive Brokers account.
QuantAscent is in closed alpha, opening to the public in Fall 2026. Leave your email and we'll let you know when major features land — and the moment it's available.
Questions in the meantime? Drop a line to [email protected].